Small Cap Tech in a Very Bullish Rounding Bottom
The bullish rounding bottom pattern is another very bullish chart pattern that offers many great trading opportunities during a market uptrend.
Top traders generally have strong knowledge in a few key areas including analyzing the overall market trend, trend analysis on individual stocks, the behavior of stocks around key moving averages, and chart patterns. Reading the description of the top chart patterns on this site is a good place to start.
The rounding bottom is a close cousin to the well-known cup with handle pattern. In fact, all swing trading cup and handle patterns have to form a rounding bottom and reach their entry point before forming a quality cup and handle pattern.
In this blog post I will review the rounding bottom pattern and show you a great setup on NPTN that is still in play for next week.
As the name suggests, the rounding bottom is where a stock pulls back but the downtrend gradually becomes less steep, forming a rounding shape on the chart. For swing traders, you want to find these on a weekly chart where the rounding shape can be seen much more clearly in most cases.
Here is a great example of this in the current market. Notice the difference between the weekly and daily chart on NPTN.
Here’s the weekly chart:
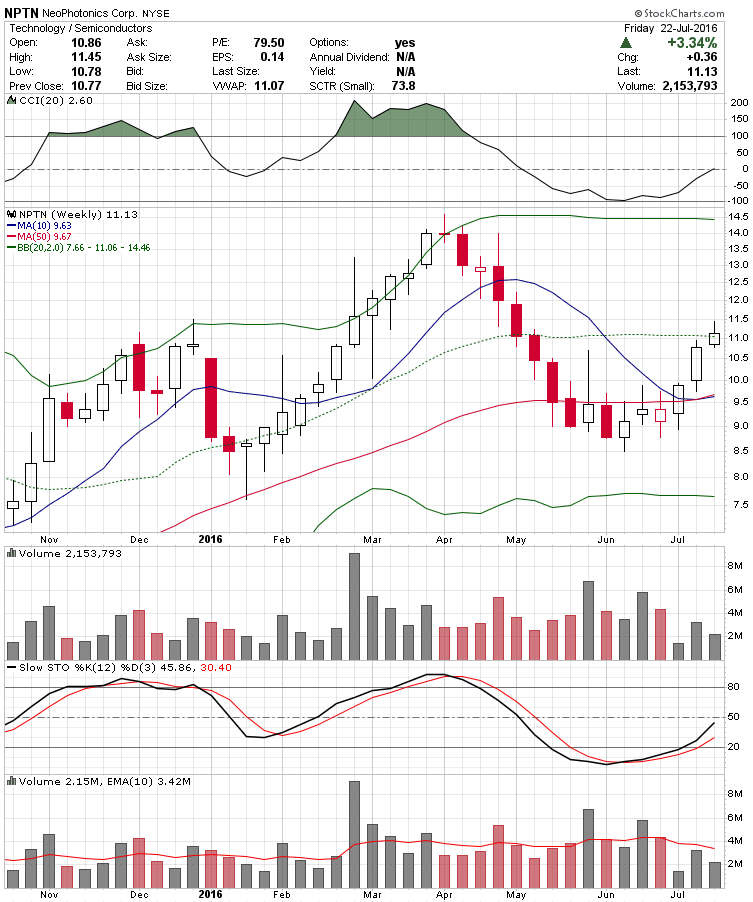
Swing Trading Setup – Rounding Bottom Pattern
On the weekly chart you can see the rounded shape clearly. Any charting package including the free version of stockcharts.com will have the weekly chart option. As you can see on the chart, this is the second rounding bottom for this stock this year.
Now the entry point is once the stock starts to make higher lows and higher highs on the right side of the base. To find a great entry point you can then look at a daily chart. You need to see a couple lower lows on the daily candles to occur before you can have a higher low.
Here’s the daily chart:
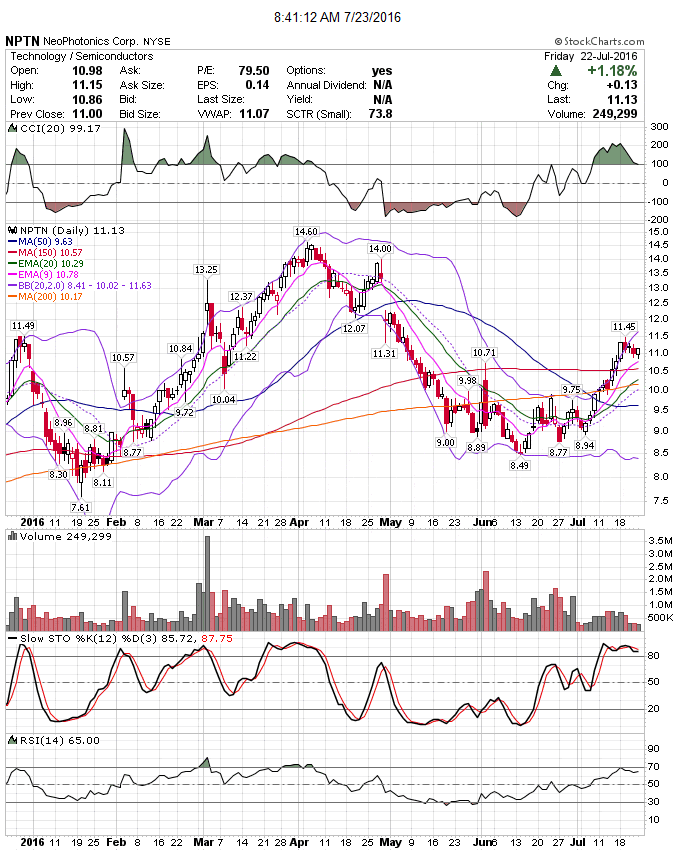
For us, the target entry was a move above $10 around July 12th. If you miss this entry, another good entry is a close above the next short-term downtrend resistance line created by connecting the highs in the most recent downtrend. Or a bullish candlestick pattern off around the 9 EMA or 20 day moving average. You want to see the former breakout area acting as strong support and a key moving average starting to act as strong support as well.
In fact, if you have day trading skills you could wait for a bullish entry point on a 5 minute or 10 minute chart off one of these support levels.
Now you could enter once the price makes a higher low – in late June in this case. However, you would likely need a wider stop-loss and it will have a higher failure rate because the trend change has not been confirmed by making the higher high.
There are a few ways to execute a stop-loss strategy. A good tight stop-loss would be a couple percent below where the price cleared the higher high. In this case, $9.75. A more conventional stop-loss would be below the prior low or below $8.94 in this case. Or below the bottom of the pattern. If this is too much risk, you would just lower your position size accordingly.
This stock has a lot of upside potential. At the point of entry, the prior high was nearly 50% above that price and offers a good aggressive target. Take some off at the next level of resistance which was about $11.30 in this case. Then you can stop the rest just below the ideal entry point.
One reason this setup made it into our newsletter is that it had the strong long-term uptrend on a multi-year chart. And strong growth in sales and earnings.
Also, the company consistently beats earnings expectations with rising future consensus estimates. The stock has to be either a strong growth stock or be beating estimates with steady to rising estimates to be presented to our customers. This stock has both qualities.
Now because they have the strong results to back up the move in the stock price, this stock could break through the 52-week highs. But you just have to wait and see how this plays out. If it does not look strong near $13 to $14, then you could take the rest off and wait for another good technical setup.
Subscribe to our Youtube channel to learn more about swing trading and our proven methodologies.
Get Ideal Trading Setups with Rapidly Improving Fundamentals Poised to Move This Week