
Large Chart Patterns Yielding Big Profits
In our last blog post we talked about ELMD breaking out of a very large symmetrical triangle pattern. In the Youtube video covering this trade we explained how you can come up with a more aggressive target and said that it was between $6 and $6.25.
After the video was published, the stock continued to rally and hit $6.26 before pulling back.
A pretty text book symmetrical triangle trade, one of our favorite trading triangles.
But our other top trading setup for the week was also a tremendous trading setup. And is off to a good start towards our target.
This stock is in one of the hottest chart patterns this year – the bullish inverted J pattern. As with other successful chart pattern breakouts we called this year, this one was a very large pattern – meaning the price change from the start of the pattern to the top of it was more than 40% as was the case with HA, GRAM, X, SBGL, ELMD and many others appearing in our newsletter this year before making a big move.
This year its been all about being in the best trading setups, with the best near-term fundamental characteristics, but in very large and well-formed chart patterns. You don’t find them every week but they have been yielding huge profits when they come along while being much safer than penny stocks.
ACTG was the featured trading setup – our top pick for the week. This stock had some of the best earnings estimate revisions in the market with a 30% increase in future estimates over the past month.
We only feature stocks to customers that have the short-term fundamental factors to support a big move higher out of the technical pattern with real results to justify a higher valuation.
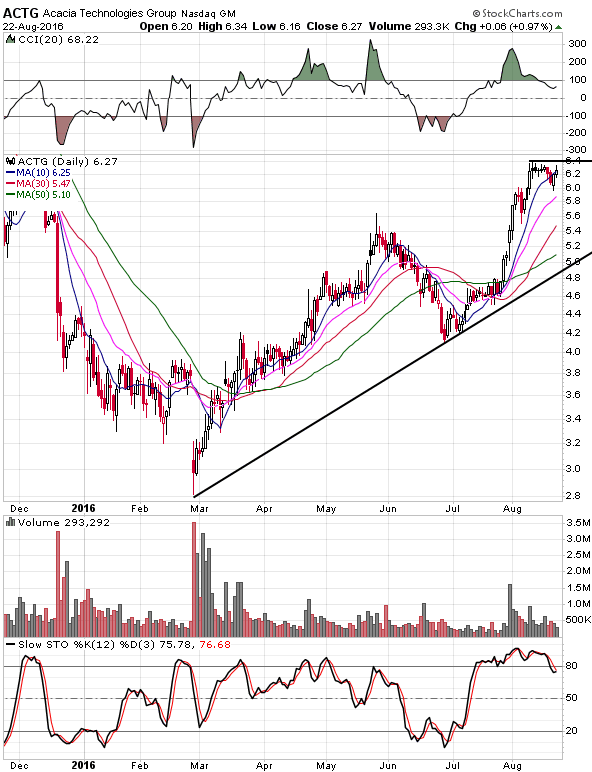
Swing Trading Setup – Inverted J Pattern on ACTG
The chart above shows the pattern as it was developing when we featured it to customers. The ideal entry point is a move above the high or when the stock makes a higher low on the right-side of the base and then a higher high. Stocks with a smaller pullback on the right-side of the base are actually better as long as the fundamentals are rapidly improving.
The price exploded through the entry point a few days after appearing in our Weekly Alert.
For those day traders among us, the price had a very nice horizontal consolidation on a 5 minute chart after reaching the swing trading entry point. The horizontal consolidation being a little above the ideal swing trading entry point which is perfect. Once the price breaks out of that consolidation, it often makes a big move – in this case about 10% within a couple days.
This is a great example of the power of multiple time-frame alignment. The great entry point on a daily chart and then a tight horizontal consolidation near that entry point (ideally just above it) on an intra-day chart followed by the breakout.
The stock quickly gained 12% within a couple days from the swing trading entry point. ELMD quickly gained 25% from the ideal entry point but ACTG may beat that in the days ahead as it just broke out a couple trading days ago with upside potential.
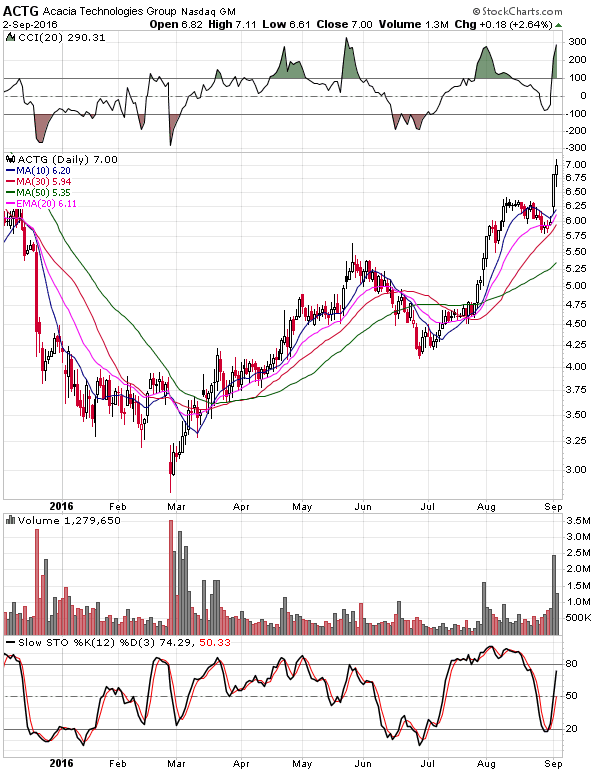
Swing trading breakout – off to a strong start.
So look for the larger chart patterns on a daily chart, rapidly improving fundamental factors that can support the price move and nail the entry point with a tight stop-loss. Its been a recipe for success again in this latest market uptrend.
Get Ideal Trading Setups with Rapidly Improving Fundamentals Poised to Move This Week


